Spectrometers use light wavelengths to investigate the chemical composition of a sample. Atomic spectrometers use an analytical method by which one or several elements in unknown mixtures can be detected.

Spectrophotometers
Spectrophotometers measure or compare specific wavelengths of a sample’s optical spectrum.
General Information
Spectrophotometers are used to analyze the optical properties of a sample by shining a beam of light into it. The transmittance of the sample is measured by a photosensitive detector or group of detectors, placed behind the sample.
Spectrophotometers measure the absorbance, A, or the transmittance, %T, of a beam of light of a certain wavelength. Wavelengths of lights within a certain bandwidth can be selected.
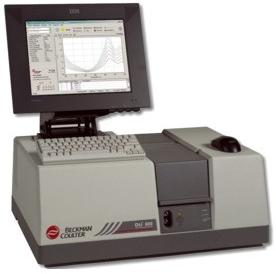
The DU 800 is for Laboratory Use Only; not for use in diagnostic procedures.
Equipment Design
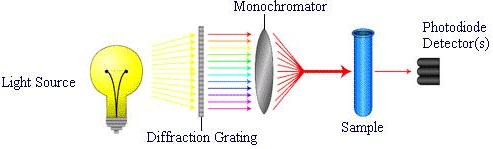
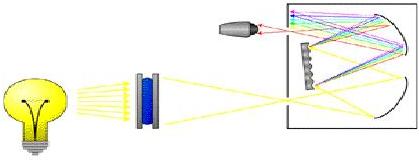
A spectrophotometer consists of a light source , diffraction grating , monochromator , and a detector , as shown below. The light source emits radiation in the visible, infrared, or ultraviolet regions of the electromagnetic spectrum. The diffraction grating spreads this radiation into a spectrum. The monochromator absorbs this wide spectrum and filters a narrow band of wavelengths through the sample to a detector. The detector(s) measure(s) the intensity of the wavelengths of light that are transmitted through the sample.
The fraction of light absorbed is the absorbance, A, and the percent of light not absorbed is the percent transmittance, %T. The absorbance and transmittance are characteristics of a sample and allow for identification of substances as well as concentrations of the specific species.
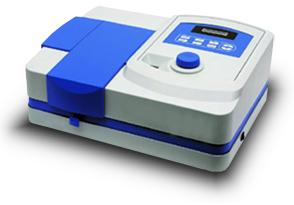
The animation shown here represents a typical spectrophotometer. The right knob on top of the spectrophotometer is used to set the wavelength. The front lower right knob is the light control, and the lower left knob is the amplitude control. After a sample is placed into the spectrophotometer and the machine undergoes the process shown here, the window displays the determined %T or A.
To standardize the wavelength, the amplifier knob is used to set the display reading to 0% T and a test tube of water is added to the sample holder. The light control knob is used to set the display to 100% T. The test tube of water is removed and replaced by the sample test tube, which is then processed by the spectrophotometer.
Usage Examples
The use of spectrophotometers ranges from process monitoring to excitation and emission of fluorescent particles. Spectrophotometers are important in studying electron-transfer, proton-transfer reactions, diffusion-controlled reactions, and in many other areas.
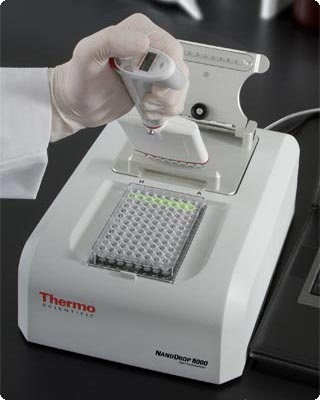
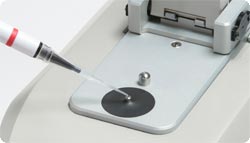
Spectrophotometers are also found in the food industry, to measure concentrations of protein in wheat, and fat content in the milk. The picture below shows a spectrophotometer used to quantify the amount of nucleic acid and protein in a sample. Spectrophotometers are also used by geologists to study the properties of various soil samples.
Advantages
- Can be used to identify an unknown sample through characteristics of the sample’s optical spectrum.
Disadvantages
- Absorbance spectrophotometry expensive due to complexity.
- Optical distortion due to convex source sample vials can result in faulty readings.
Mass Spectrometers
Mass spectrometers are used to determine elemental compositions.
General Information
Mass spectrometers produce ions from the chemical substance that is being analyzed. The mass spectrometer then uses magnetic and electric fields to measure the mass of these ions.
The substance is placed into a vacuum chamber, or ion source, where it is bombarded with an electron beam. Some of the electrons from the beam knock electrons off the sample, leaving charged ions behind. Some collisions are so strong that molecules are knocked into smaller pieces, or fragments. Every chemical substance has a limited number of possible fragments, which can in turn be used to identify the composition of a sample.
A mass spectrometer produces a plot of the mass spectra of a chemical substance. The plot is defined by the mass-to-charge (m/e) ratio vs the relative intensity or abundance of each substance. For example, the mass spectra of water and ammonium are shown below. Both water and ammonium have a mass of 18, but when split into their fragments, exhibit different spectra: Water results in peaks at 17 and 16 m/e, whereas ammonia has additional peaks at 14 and 15 m/e.
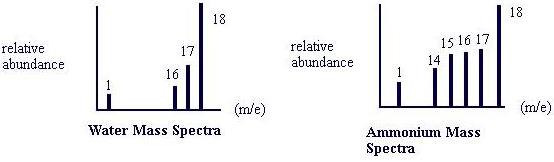
Note that the power of a spectrometer is measured by the resolution of a substance’s mass spectra. Resolution is defined as m/Δm, where m is the mass of the ion and Δm is the difference between two peaks in a system. In other words, a mass spectrometer of resolution 100 can tell the difference between a peak of 18 and 17.9 in the water mass spectra plot shown above.
Equipment Design
As shown in the schematic, mass spectrometers generally consist of an ion source in which molecules are ionized; an analyzer, where ions are separated by their mass-to-charge ratio; and a detector that registers the number of ions.
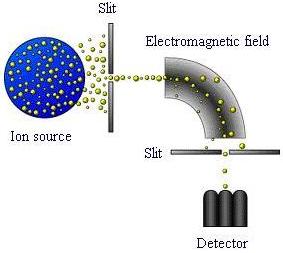
The ion source contains a mixture of ions with different mass-to-charge ratios. These ions travel, contact the electromagnetic field from an electric and/or magnetic source, and are separated according to their mass-to-charge (m/e) ratio. Another slit allows a certain fraction of ions to reach the detector. This slit will be large if many ions need to be detected and low resolution is acceptable. Otherwise a small slit would be used.
Mass spectrometers are categorized based on the method of ionization , ion analysis , and mode of detection .
Usage Examples
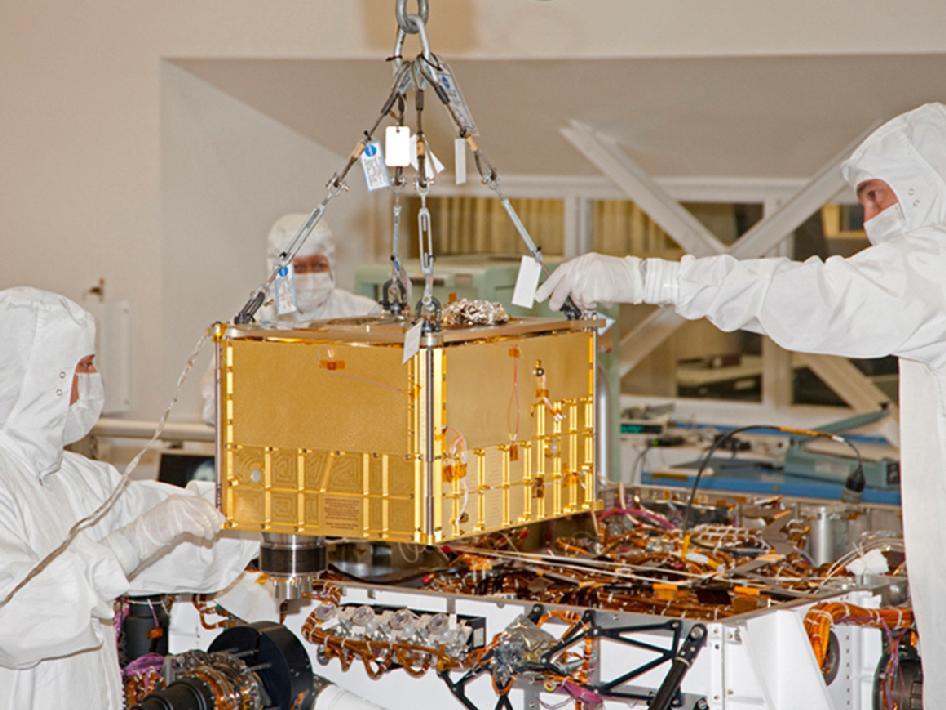
Mass spectrometers are used for a wide variety of analyses, from environmental toxins to petroleum products. In the picture below, the Sample Analysis at Mars (SAM) instrument is getting installed into NASA’s Mars rover, Curiosity. Curiosity will be used in NASA’s Mars Science Laboratory mission to analyze the geological surface of Mars. The SAM contains a mass spectrometer that will check Mars for elements that are essential to life as we know it, such as nitrogen, phosphorous, sulfur, oxygen and carbon.
Pictured below is an illustration of NASA’s Curiosity rover, equipped with a mass spectrometer, on Mars’ surface.

Mass spectrometers are widely used in laboratories for educational purposes and in the field to study the emission of molecules. They are also used to help trace metals and biological materials, including the products of genetic engineering.
Advantages
- Magnetic sector mass spectrometers have high resolution.
- Relatively quick readings.
Disadvantages
- Quadrupole mass spectrometers have limited resolution.
- Some ionization methods are not suited well for some ion analyzers or detectors.
- Expensive.
Infrared Spectrometers
Infrared spectrometers are used to measure the wavelength and intensity of the absorption of infrared radiation by a sample. The measurements provide valuable chemical composition information.
General Information
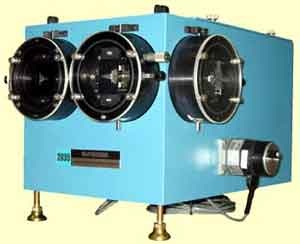
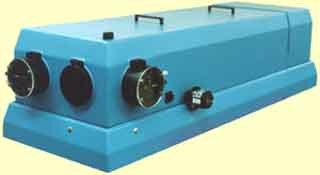
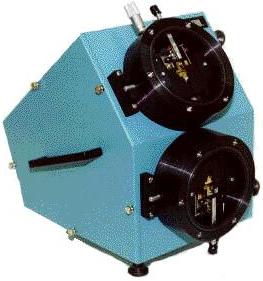
Infrared spectrometers, such as the one shown here, measure the frequencies at which the sample absorbs the radiation and the intensities of the absorptions. The infrared radiation excites the molecular vibrations to higher energy levels. Excited vibrations that cause a change in the dipole of a molecule are picked up by the spectrometer. Vibrations that do not affect the dipole are said to be infrared inactive. For this reason, complete analysis of a sample is usually difficult.
Equipment Design
Shown below is a schematic of an infrared spectrometer. The sample is loaded into the spectrometer and a light source sends infrared radiation towards it. The sample absorbs some of the radiation and the exiting radiation is sent to a monochromator (as in the schematic) or interferometer to isolate the desired wavelength. This filtered signal is sent to the detectors , where the signal is analyzed. The analyzed data is sent to a computer where the information can be displayed.
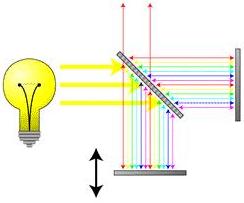
Interferometers are similar to monochromators in that they also isolate a specific portion of the electromagnetic spectrum. Interference is used to selectively transmit a certain wavelength. Interferometers are the more popular filter on modern infrared spectrometers.
The wave enters, is split by a beam splitter, and is sent to two mirrors. One mirror is free to move, while the other is fixed. The mirrors reflect the wave back to the beam splitter, where they are once again joined. The action of the moving mirror and the beam splitter allow for interference between the light patterns, and only selected wavelengths are transmitted out.
Usage Examples
Infrared spectrometers are used in pharmaceutical and environmental applications. They are particularly valuable for laboratory testing. The picture below shows an infrared spectrometer that is used primarily in laboratory testing of rock samples. Laboratory experiments with spectrometers can be used for qualitative as well as quantitative analysis of samples.
(Copyright McPherson Inc., Chelmsford, MA 01824)
Advantages
- Able to identify sample composition.
- After calibration, concentration of unknown samples is possible.
- Solvents can be used for solids.
Disadvantages
- Sensitive to polar bonds, so some functional groups don’t show.
- Symmetric stretches are often infrared inactive because they don’t change the dipole.
- Complex molecules are difficult to interpret and analyze.
Atomic Absorption
Atomic absorption spectroscopy is an analytical method that allows the user to determine the presence and concentration of one element in a mixture for each run.
General Information
One characteristic of atoms is their ability to absorb light. In atomic absorption spectroscopy, heat applied to a solution by a flame or graphite furnace produces free atoms which absorb light from a primary source. Atomic absorption analyses the frequencies or wavelengths of the absorbed light to characterize the elements present.
Equipment Design
In an atomic absorption spectrometer a lamp emits radiation that is absorbed by an atomized sample . The radiation, continues on to a monochromator , where the signal is filtered. This filtered signal is picked up by a detector . The detector is usually linked to a computer or similar device in which the result of the scan can be displayed.
Using a flame to atomize the solution is the conventional method. The sample is aspirated into a specific flame. The vapor supply to the furnace is either air-acetylene or nitrous oxide-acetylene.
Using a graphite furnace to atomize the sample is the more efficient of the two methods. Although the process takes longer than for a flame, less sample is required and better results can be found. The graphite furnace contains a tube of graphite with an electric current running through it . The electric current heats the graphite to several temperatures that correspond to steps in the atomization. The first step is to dry the sample. Next the furnace is hot enough to ash the organic matter. Finally, the analyte atoms are vaporized.
Usage Examples
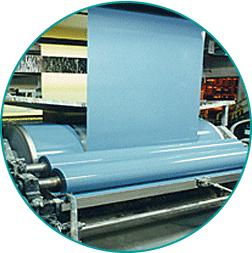
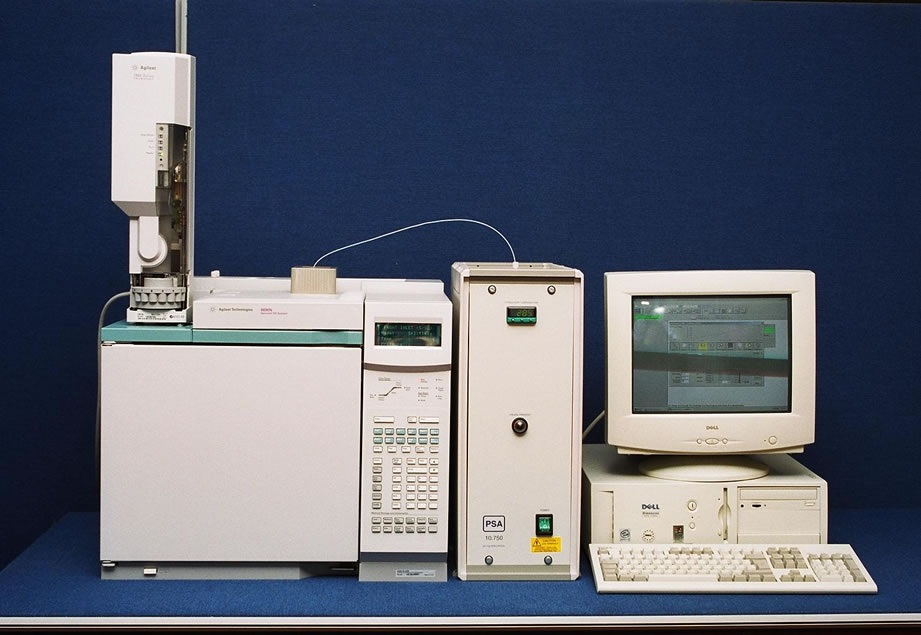
Atomic absorption is used to test industrial materials. It is commonly used in the steel, petroleum, and paint/coatings industries. The picture shown here shows a coil being coated by a product that can be tested for contaminants using atomic absorption spectroscopy.
Atomic absorption spectroscopy can be used in testing clinical and biological materials. It can determine the presence and amount of any metal in blood, urine, and synovial fluids.
Test kits are also used by law enforcement to determine the presence of barium, antimony, copper, and lead on a suspect’s hands. These elements will be found on the hands of someone who has just fired a gun. The crime laboratory uses a swab of the suspect’s hands in an atomic absorption spectrometer.
Atomic absorption spectroscopy is also used in environmental applications. It can be used to test natural waters, sediments, and plant materials. It is important in the testing of drinking water by water treatment plants to ensure safe amounts of materials such as lead, excessive nitrates, and radon.
Advantages
- Graphite furnace atomic absorption can accept solutions, slurries, or solid samples.
- Graphite furnace is a reducing environment for easily oxidized elements so that the risk of rust interfering with the measurements is minimal.
- Easy to use and have reasonable detection limits.
- Best used for identifying metals.
Disadvantages
- Furnace atomic absorption can only analyze solutions, no solids or slurries.
- Many interferences due to the structure of the molecules or the composition of the mixture are common. Can be controlled if recognized.
Atomic Emission
Unlike atomic absorption spectrometry, which can only determine the presence of one element at a time, atomic emission spectroscopy can measure multiple elements at once.
General Information
Atoms can emit light when they move from an unstable steady state to a stable one. In atomic emission spectroscopy, a sufficient amount of thermal or electrical energy is required to excite atoms in an unknown mixture into the unstable state. As they return to a more stable configuration, light is emitted from the atoms. The wavelength of light is dependent on the elements present in the mixture.
Equipment Design
Atomic emission spectrometers are similar in design to those used in atomic absorption. One difference is that no primary light source is necessary. Also, instead of a monochromator, a polychromator is used to simultaneously measure several elements.
Another difference is in the heat source. Energy is required to not only atomize the sample, but also excite the atoms into an unstable steady state. Atomic emission spectrometers use one of two types of heat sources: ICP or spark/arc.
ICP-AES
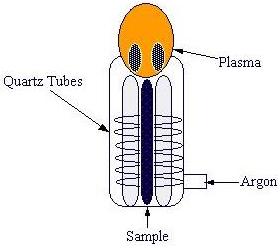
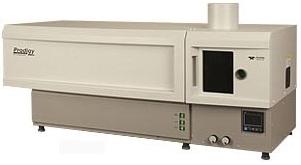
Inductively-Coupled Plasma Atomic Emission Spectroscopy, ICP-AES, is a high temperature (5500-8000 K) source of excitation for the elements in the sample. The plasma is typically created by flowing argon gas through quartz tubes. A radiofrequency (RF) generator creates a magnetic field in coils surrounding the tubes. The sample is then excited, and the argon gas carries it to the polychromator and detector.
Spark/Arc
Two metal or graphite electrodes are used in spark/arc emission. The source of energy is a current pulse in spark. In arc, continuous electrical discharge is the source. The amount of energy transferred to the sample is enough to atomize it and excite the atoms.
Usage Examples
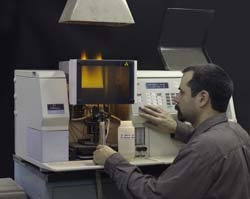
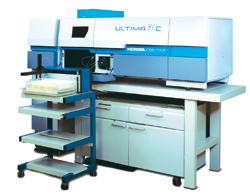
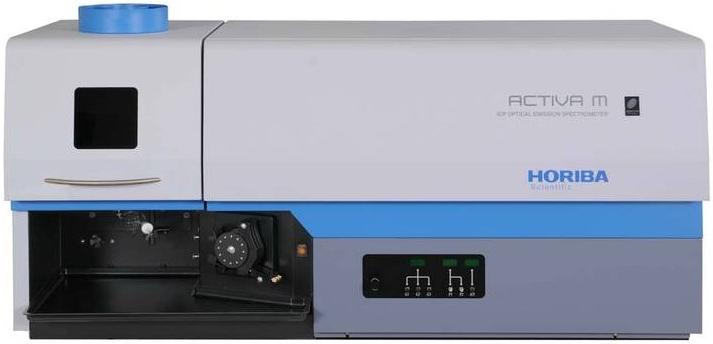
ICP atomic emission spectrometers are used to find metals in many substances. In the picture below, ICP spectroscopy is used for elemental analysis of samples in a lab. They can be used in metal coating and painting industries. They are also commonly used in food and drug manufacturing to determine the amount of nutrients in a sample. For example, they are used to determine the amount of calcium in dairy products.
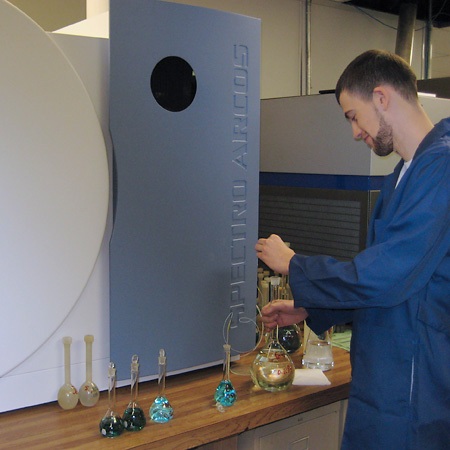
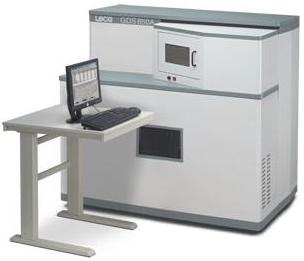
Spark/Arc atomic emission spectroscopy is best used in controlling the processing of alloys. It is used in metal processing, inspection of materials, and quality control. For example, an atomic emission spectrometer could be used to determine the purity of gold, as shown below.

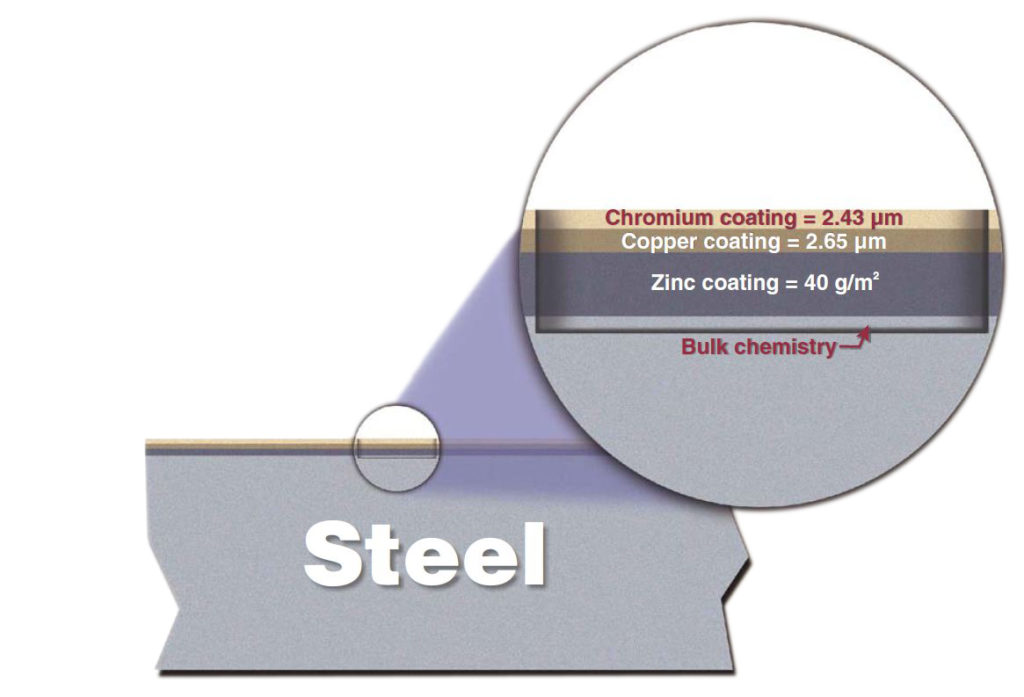
Glow discharge atomic emission spectroscopy is used in determining the metal composition in chemical and physical processes. The process below shows a piece of equipment being galvanized. It is important to maintain the bath as 98% pure molten zinc. Atomic emission spectroscopy can be used to test samples of the bath to ensure its purity.
Advantages
- Able to identify multiple elements simultaneously.
- Rapid analysis time, yet inherent accuracy in results.
Disadvantages
- High-resolution equipment necessary to read the differences in the close spectral lines.
- More costly than atomic absorption spectrometry.
Atomic Fluorescence
Atomic fluorescence spectroscopy uses the emission of light by atoms that have been excited to higher energy levels through the absorption of electromagnetic radiation to identify unknown mixtures.
General Information
Atomic fluorescence spectrometers combine functions of the atomic absorption and atomic emission spectrometers. As in atomic absorption spectrometers, atomic fluorescence spectrometers identify one element at a time. However, as in atomic emission spectrometry, they characterize the elements by the amount of light emitted. The major difference between the three types of atomic spectroscopy is the source of excitation.
Equipment Design
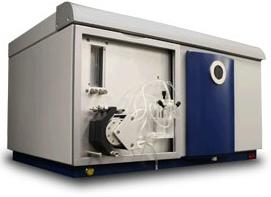
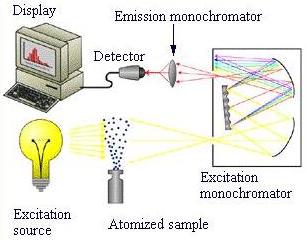
This schematic shows the design of a basic atomic fluorescence spectrometer. An excitation source emits light that is passed through an atomized sample. The emitted radiation continues on to two monochromators , where the signal is filtered. This filtered signal is picked up by a detector . The detector is normally linked to a computer where the results are displayed.
Usage Examples
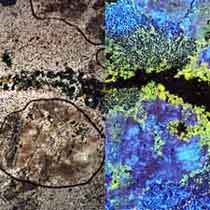
Atomic fluorescence spectrometers are useful in a variety of industries. Many pharmaceutical, clinical, and environmental companies use them. They are also particularly useful in determining the presence of certain metals in geological, agricultural, and metallurgical applications. Atomic fluorescence spectrometers can be used to help identify metals at mining sites such as the one shown below.

Advantages
- Greater sensitivity than absorption methods.
Disadvantages
- Can only identify one element per run.
Acknowledgements
- Anoplate Corporation, Syracuse, NY
- Aurora Biomed Inc., Vancouver, B.C.
- Beckman Coulter, Inc.
- HORIBA, Ltd., Edison, NJ
- Laboratory Testing Inc., Hatfield, PA
- LECO Corporation, St. Joseph, MI
- McPherson Inc., Chelmsford, MA
- NanoDrop products, Wilmington, DE
- National Coil Coating Association, Cleveland, OH
- NASA/JPL-Caltech
- P S Analytical, Deerfield Beech, FL
- Sioux Corporation, Beresford, SD
- Teledyne Leeman Labs, Hudson, NH
References
- Considine, P. E., D.M., and G.D. Considine. “Spectroscope.” Van Nostrand’s Scientific Encyclopedia . 8th ed. 1995. Print.
- Hanby, John D. “Fiberoptic Spectrometer Helps Clean up Environment.” Laser Focus World . 76 (1996): 145. Print.
- Jasny, J., J. Sepit, J. Karpiuk, and J. Gilewski. “Nanosecond Transient Absorption Spectrophotometer with Dye Laser Probing and Computer Control.” Review of Scientific Instruments . 65 (1994): 3646-3651. Print.
- Lysaght, M.J., J.A. van Zee, and J.B. Callis. “Laptop Chemistry: A Fiber-optic, Field-portable, Near Infrared Spectrometer.” Review of Scientific Instruments . 62 (1991): 507-515. Print.
- Moral, B. A., and F. Rodriguez. “New Double Beam Spectrophotometer for Microsamples. Application to Hydrostatic Pressure Experiments.” Review of Scientific Instruments . 66 (1995): 5178-5182. Print.
- Purcell, Frank. “Imaging Spectrographs Perform Multidimensional Spectroscopy.” Laser Focus World . 89 (1993): 93-97. Print.
- Renn, C.N., and R.E. Synovec. “Single Optical Fiber, Position-Sensitive Detector-Based Multiwavelength Absorbance Spectrophotometer.” Analytical Chemistry . 62 (1990): 558-564. Print.
- Slavin, Walter. Atomic Absorption Spectroscopy . New York: Interscience Publishers, 1968. Print.
- Spear, J.D., and R.E. Russo. “Lens Correction for the Implementation of Cylindrical Vessels in a Spectrophotometer.” Review of Scientific Instruments . 63 (1992): 4457-4458. Print.
- Studt, Tim. “Here’s a New Benchtop LC/MS.” Research & Development . 87 (1991): 61. Print.
- Tran, C.D., and G.-H. Gao. “Characterization of an Erbium-Doped Fiber Amplifier as a Light Source and DevelOpment of a Near-Infrared Spectrophotometer Based on the EDFA and an Acoustoopic Tunable Filter.” Analytical Chemistry . 68 (1996): 2264-2269. Print.
- Webster, Guy. “NASA Mars Rover Will Check for Ingredients of Life.” NASA . Ed. Tony Greicius. 18 Jan. 2011. Web. 7 Nov. 2011.
- Wilks, Jr., Paul A. “The Evolution of Commercial IR Spectrometers and the People Who Made It Happen.” Analytical Chemistry . 64 (1992): 833A-838A. Print.
- Winge, R.K. Inductively Coupled Plasma-Emission Spectroscopy. Springfield: Environmental Protection Agency, 1978. Print.
Developers
- Katie Clise
- Jonathan West
- Chris Seadeek
- Steve Wesorick
- Kelsey Kaplan
- Henry Chen